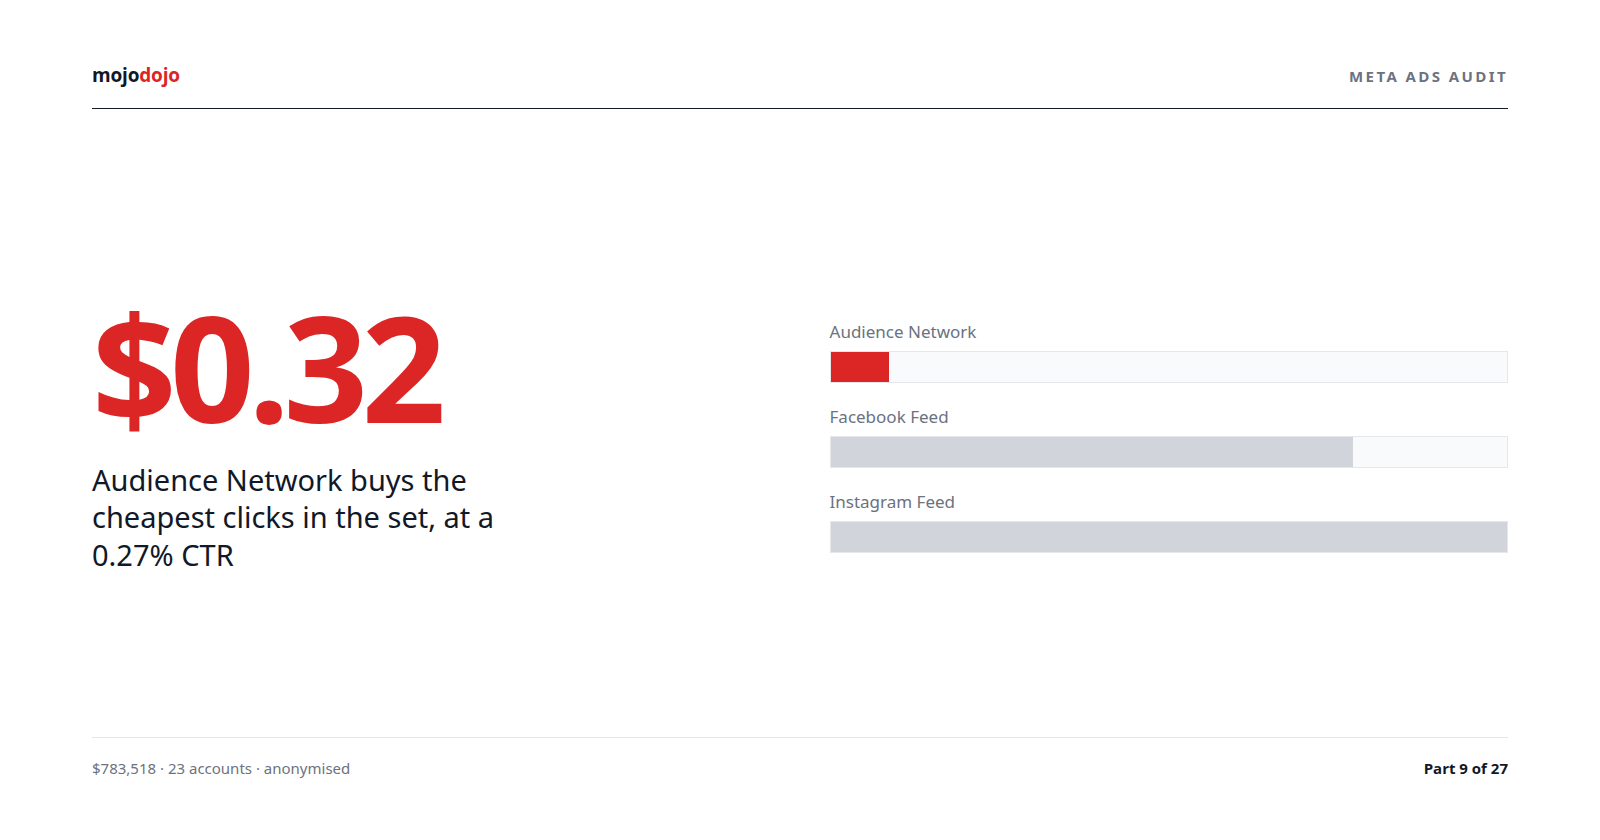


Meta Ads: Instagram Feed out-clicked Facebook Feed 3.1% to 2.4% on a quarter of the budget
Facebook Feed and Instagram Feed are the two placements that look most alike. Same ad, same creative, same square or vertical image, scrolled past in the same way. Across the 23 accounts in this audit ($783,518 AUD pooled, lifetime) they were funded very differently: Facebook Feed took 44.6% of spend and Instagram Feed 11.8%. Instagram Feed's budget was roughly a quarter of Facebook Feed's, and Instagram as a whole platform (Feed, Stories, Reels and Explore together) took 24.3% of the pool against Facebook's 73.9%.
On the two metrics that describe what happened after the impression, Instagram Feed won. Its click-through rate was 3.1% against Facebook Feed's 2.4%, and 67.5% of its clicks went on to fire a landing page view against 35.6%. On the two metrics that describe what it cost, Instagram Feed lost: $27.09 CPM against $17.15, and $0.87 per click against $0.72. And on the one metric that describes what the advertiser was actually buying, it lost again: $48 per reported lead against $34.
This post puts those five numbers side by side and asks what each is worth. We pulled the placement table from the account insights edge with the publisher_platform and platform_position breakdowns, lifetime, pooled across all AUD accounts. Parts 9 to 12 all draw on it; this one takes the Instagram Feed row.
The row against Feed
Placement | Share of spend | Impressions | CPM | CTR | CPC | Landing views ÷ clicks | Leads | CPL |
|---|---|---|---|---|---|---|---|---|
facebook/feed | 44.6% | 20,474,622 | $17.15 | 2.4% | $0.72 | 35.6% | 10,223 | $34 |
instagram/feed | 11.8% | 3,428,991 | $27.09 | 3.1% | $0.87 | 67.5% | 1,925 | $48 |
Instagram Feed served a sixth as many impressions on about a quarter of the money, which is the CPM gap expressed a different way. Every Instagram impression was then more likely to be clicked, and every click was almost twice as likely to reach the advertiser's page. Then the reported lead count did not keep pace with the landings.
What each metric is worth
Metric | Facebook Feed | Instagram Feed | Instagram ÷ Facebook |
|---|---|---|---|
CPM | $17.15 | $27.09 | 1.58x (Instagram dearer) |
CTR | 2.4% | 3.1% | 1.29x (Instagram better) |
CPC | $0.72 | $0.87 | 1.21x (Instagram dearer) |
Landing views ÷ clicks | 35.6% | 67.5% | 1.90x (Instagram better) |
Cost per landing page view (CPC ÷ landing-view rate) | $2.02 | $1.29 | 0.64x (Instagram cheaper) |
CPL (mixed definitions, direction only) | $34 | $48 | 1.41x (Instagram dearer) |
Follow the sequence. Instagram Feed impressions cost 58% more. The better click rate claws back most of that, so Instagram clicks cost only 21% more. The much better landing-view rate then overturns it: a person on the advertiser's page costs about $1.29 from Instagram Feed and about $2.02 from Facebook Feed. At the landing, Instagram Feed is the cheaper placement by a third. Then the lead column reverses it again, and Instagram Feed ends up 41% dearer per reported lead.
Cost per landing page view is not a column in Ads Manager. It is CPC divided by the landing-view rate, both of which the pull publishes, and it is the metric that makes the CPM and CPC comparison look like the wrong argument. The case against Instagram Feed cannot rest on it being expensive at the impression, because it is cheaper at the landing. The case has to be made on what happens after the landing, which is the part of the sequence that has nothing to do with the placement's price and everything to do with the person and the page.
Where it sits in the ranking
Eighteen placements in the table; twelve took at least 1% of pooled spend and the rest are under $5,000 each. Both Feeds are ranked here against both groups.
Metric | Facebook Feed, rank of 18 | Facebook Feed, rank of 12 | Instagram Feed, rank of 18 | Instagram Feed, rank of 12 |
|---|---|---|---|---|
CPM (lowest first) | 12th | 7th | 16th | 10th |
CTR (highest first) | 5th | 4th | 3rd | 2nd |
CPC (lowest first) | 9th | 6th | 12th | 8th |
Landing views ÷ clicks (highest first) | 12th | 8th | 3rd | 3rd |
Cost per landing page view (lowest first) | 9th | 6th | 6th | 3rd |
CPL (lowest first) | 7th | 6th | 14th | 11th |
Instagram Feed is a top-three placement on CTR and landing-view rate and a bottom-three major placement on CPM and cost per lead. Facebook Feed is mid-table on everything, which is roughly what you would expect from the placement that carries 44.6% of the money: it is the average. The interesting placements are the ones that are good at one end of the sequence and bad at the other, and Instagram Feed is the cleanest case of that after Marketplace in part 10.
Why the clicks land and the leads do not
The landing-view gap is large enough to need an explanation, and we have two candidates. The pull does not let us separate them.
The first is the counting. The click figures in this pull are Meta's all-clicks count (998,999 clicks in the pool against 733,847 link clicks in part 27), and all-clicks in Facebook Feed includes reactions, comments, shares, "see more" expands and page-name taps. Facebook Feed ads have more things to tap that are not the link than Instagram Feed ads do, so a larger share of Facebook Feed's clicks were never going to a landing page. Some of Instagram Feed's 67.5% is a cleaner denominator.
The second is the audience. The people who tap an Instagram Feed ad through to a website are, on this evidence, more inclined to wait for the page. Whether that is the app, the demographic or the creative, the pull cannot say.
Then the leads. Instagram Feed produced a landing at 0.64x Feed's price and a reported lead at 1.41x Feed's price, so its landing-to-lead rate was less than half of Facebook Feed's, on the leads the accounts chose to count. Two caveats apply and both soften the size without changing the direction. The leads column is "each account's own lead event summed (mixed definitions, use for direction only)" as we labelled it in the table, and some of those events are messaging or onsite actions that never needed a landing. And Meta's default attribution credits a one-day view, so a share of Facebook Feed's 10,223 leads came from people who saw the ad and converted without clicking, which flatters Facebook Feed's landing-to-lead rate.
There is a third possibility specific to lead generation. Most accounts in this set sell services to people in a particular city, and the lead is a quote request or a call. If Instagram Feed's traffic is more browse than buy, then more people click, more of them land, and fewer of them need a quote this month. That does not make Instagram Feed a bad placement. It makes its cheap landings worth less each, which is exactly what the traffic columns cannot show.
What it does to decisions
The budget split between the two Feeds is only partly an advertiser decision. In an Advantage+ placements ad set, Meta allocates across placements to hit the optimisation goal at the lowest cost, and the advertiser sees the split after the fact. In a manual placements ad set the advertiser picks the placements and Meta allocates within them. Part 18 shows 58.2% of ad sets in the set are manual, and the ad-set-level placement spend is not in the pull, so we cannot say how the 44.6% to 11.8% split arose.
What we can say is which metric the split looks right on. On CPM and CPC, Facebook Feed is cheaper and the heavier weighting is defensible. On cost per landing page view, Instagram Feed is cheaper and the split looks backwards. On reported cost per lead, Facebook Feed is cheaper again and the split looks right. An advertiser can justify the current allocation, or its reverse, by choosing which column to point at. The delivery system optimises to one event, and if that event is the lead it will have learned what this table shows.
The reporting trap is a placement-level one. Anyone reviewing a placement breakdown with CTR and landing-view rate showing will conclude Instagram Feed is under-funded. Anyone reviewing it with CPM and CPC showing will conclude it is over-funded. Both are reading real numbers. Neither is reading the number the business pays.
This is the same argument as the Google Ads series makes about comparing channels in Performance Max vs Search cost per lead: the click-level columns and the lead-level column can rank two channels in opposite orders, and the lead-level column is the only one that pays the invoice.
Where it varies
The placement table is pooled and the pull does not publish it per account or per band, so we cannot say whether a consumer goods account got a better Instagram Feed result than a trades account. What the pull does let us do is set Instagram Feed next to the rest of the Instagram platform, which shows that Feed is not the representative Instagram placement.
Placement | Share of spend | CPM | CTR | CPC | Landing views ÷ clicks | CPL |
|---|---|---|---|---|---|---|
facebook/feed (benchmark) | 44.6% | $17.15 | 2.4% | $0.72 | 35.6% | $34 |
instagram/feed | 11.8% | $27.09 | 3.1% | $0.87 | 67.5% | $48 |
instagram/instagram_stories | 7.9% | $19.21 | 2.5% | $0.76 | 52.6% | $40 |
instagram/instagram_reels | 4.3% | $15.28 | 1.4% | $1.12 | 37.1% | $39 |
instagram/instagram_explore | 0.2% | $8.05 | 1.7% | $0.48 | 46.9% | $66 (19 leads, below any floor) |
Instagram Stories is the placement that most resembles Facebook Feed on price ($19.21 CPM, $0.76 CPC) while landing 52.6% of its clicks and reporting a $40 lead. Instagram Reels is cheaper per impression than Facebook Feed and a good deal dearer per click, which is the subject of part 12. At the platform level Instagram ran at a 2.4% CTR and $0.86 CPC against Facebook's 1.4% and $0.79, so the CTR advantage holds across the whole app and the CPC penalty is small. Feed is the Instagram placement with the largest CPM premium and the largest landing-view advantage, and both of those are worth knowing before treating "Instagram" as one line.
What to check in your account
Ads Manager, Breakdown by Delivery, Placement. Add Amount spent, CPM, CTR (link click-through rate), Cost per link click, Landing page views, Cost per landing page view, Results and Cost per result.
Read the Facebook Feed and Instagram Feed rows against each other on CPM and CPC first. In this set Instagram Feed was dearer on both. Note it and move on; this is not the decision.
Now compare Cost per landing page view. If Instagram Feed is cheaper here, as it was in this set, the CPM premium is being paid back by the landing-view rate and the traffic argument favours Instagram.
Compare Cost per result and check what Result means. A pixel lead or a CRM-verified event makes the comparison real. A messaging or onsite event does not depend on the landing and the comparison is not measuring what the traffic columns measure.
If Instagram Feed lands cheaply and converts expensively, as here, split the comparison by campaign objective and by creative. A placement-level result across every campaign hides whether the gap is the audience or one ad that ran mostly on Instagram.
Check whether placement asset customisation is in use. If the same landscape image is running in both Feeds, the Instagram row is testing a cropped creative, not the placement.
Check | Where | What good looks like | What this set showed |
|---|---|---|---|
CPM and CPC, Instagram vs Facebook Feed | Placement breakdown | Known and accepted, not the decision | $27.09 vs $17.15; $0.87 vs $0.72 |
Cost per landing page view | Placement breakdown | Whichever is lower gets the traffic budget | Instagram $1.29 vs Facebook $2.02 |
Cost per result | Placement breakdown | Whichever is lower gets the lead budget | Facebook $34 vs Instagram $48, direction only |
Result definition | Column settings, Results | One event, pixel or CRM | Mixed across accounts |
Placement asset customisation | Ad level, Placements | Creative built per placement | Not in the pull |
Reading the two Feeds by stage rather than by column is part of the first-week audit in our Facebook Ads management.
The principle
Two placements can be ranked in opposite orders by every pair of adjacent columns in the same report, and both rankings can be true. Instagram Feed is dearer at the impression, better at the click, better again at the landing, and dearer at the lead. There is no single column that summarises that, and the columns most people look at first, CPM and CPC, describe the two stages furthest from the sale. Compare placements at the last event you can measure honestly, and treat every column before it as an explanation, not a verdict.