$783,518 of Meta Ads: What 23 Accounts Actually Bought
Twenty-three Meta Ads accounts. Australian businesses across five industries, the oldest campaign built in 2013, the newest in the week we pulled the data. Between them they spent $783,518 AUD, bought 999,000 clicks from 77.7 million impressions, and built 1,134 campaigns, of which 67 were running on 9 September 2026.
Our $32M Google Ads series went deep on one account. This series does the opposite. It asks one question of twenty-three accounts and reports what recurs. A finding that shows up in one account is that advertiser's mistake. A finding that shows up in nineteen of twenty-three is the platform.
Every number was pulled from the Meta Marketing API v23.0 on 8 and 9 September 2026. Nothing is illustrative.
Ad accounts | 23 |
Lifetime spend (pooled, AUD) | $783,518 |
Impressions | 77.7M |
Clicks | 999,000 |
Campaigns ever built | 1,134 |
Campaigns running today | 67 |
Ad sets | 549 |
Ads | 1,078 |
History | 2013 to 2026 |
How the accounts are described
No client is named, and no single account's spend is published. Accounts appear as letters (A to W) and as one of five industry bands, each holding at least three accounts:
Industry band | Accounts |
|---|---|
Home improvement & trades | 6 |
Professional & B2B services | 5 |
Consumer goods & food | 4 |
Manufacturing & equipment | 4 |
Health & care services | 4 |
Two rules follow from that. Money is only ever shown pooled across all twenty-three, or pooled by placement, segment or year. Rates, ratios and counts are shown per band or per account letter. Two of the five bands are dominated by a single advertiser, so a band-level spend figure would identify them, and we do not publish one.
Where a ratio rests on fewer than 30 conversions or under $500 of spend, the post says so in the sentence that uses it. Several of these accounts are small. A 4x figure on three purchases is not a finding, and we have tried not to present one as if it were.
Start here
If you read one post, read the first. A column Meta names with the word "leads" reported 260,849 for an account that had 2,003. Nobody had done anything wrong. That is the point of the series: most of what follows is not advertiser error but the platform's own definitions, defaults and reporting, and what they quietly do to a budget.
Reading order
Number order is the order the argument builds: what the reported numbers are made of (1 to 7), what the platform did underneath everyone (8 to 12), what the advertisers chose or declined to choose (13 to 18), where the money actually went (19 to 23), creative (24 and 25), and the two findings we could only publish with a caveat.
Parts 1, 3, 13 and 19 stand alone. Parts 5, 6 and 7 are one argument in three pieces. Parts 9 to 12 share one placement table and are best read together.
What this series is not
It is not a benchmark. Twenty-three accounts in five industries with one advertiser dominating two of the bands is a cross-section, not a sample of the Australian market. A rate in this series tells you what happened in these accounts, and the post tells you why. Whether the same mechanism is at work in yours is what the "what to check in your account" section of each post is for.
It is also not an argument that Meta Ads does not work. Several of these accounts buy leads at $14 to $39. The argument is that the number on the dashboard is a sum of things Meta configured, at some point, for some reason, and it is only as honest as the least honest thing in it.
If you would rather have someone pull your account apart the same way, that is what our Facebook Ads management work starts with.
The 27 posts
4 of 27 publishedMeasurement: what the numbers are made of
- 1Meta Ads reported 260,849 "leads" for an account that had 2,003. The column name says leadsPublishing 25 October
- 2Meta Ads reports one event under up to nine names. 21 of 23 accounts double-count if you sum the columnPublishing 28 October
- 3Meta Ads attribution inflation is bimodal: median 1.01x, but every purchase account sat at 2.2x to 4.4xPublishing 31 October
- 4Meta Ads view-through inflated purchases 2.7x and leads not at all. Instant forms are the reasonPublishing 3 November
- 5
- 6
- 7Meta Ads counts ten kinds of message as a conversion. 19 of 23 accounts report at least onePublishing 12 November
The platform itself
- 8Meta Ads CPM fell 61% from 2023 to 2025 while CTR halved. Cost per click barely movedPublishing 14 November
- 9Meta Ads Audience Network: $0.32 CPC and 0.27% CTR, the cheapest placement and the worstPublishing 18 November
- 10Meta Ads Marketplace took 6.5% of $783k at a 0.56% CTR and a $3.45 CPMPublishing 20 November
- 11Meta Ads: Instagram Feed out-clicked Facebook Feed 3.1% to 2.4% on a quarter of the budgetPublishing 24 November
- 12Meta Ads Reels: $1.48 CPC at 1.3% CTR against Feed's $0.72 and 2.4%, on 13% of spendPublishing 27 November
Targeting: the choice nobody made
- 13Meta Ads: 349 of 538 ad sets run with no interests. 254 also run 18-65, any genderPublishing 30 November
- 14
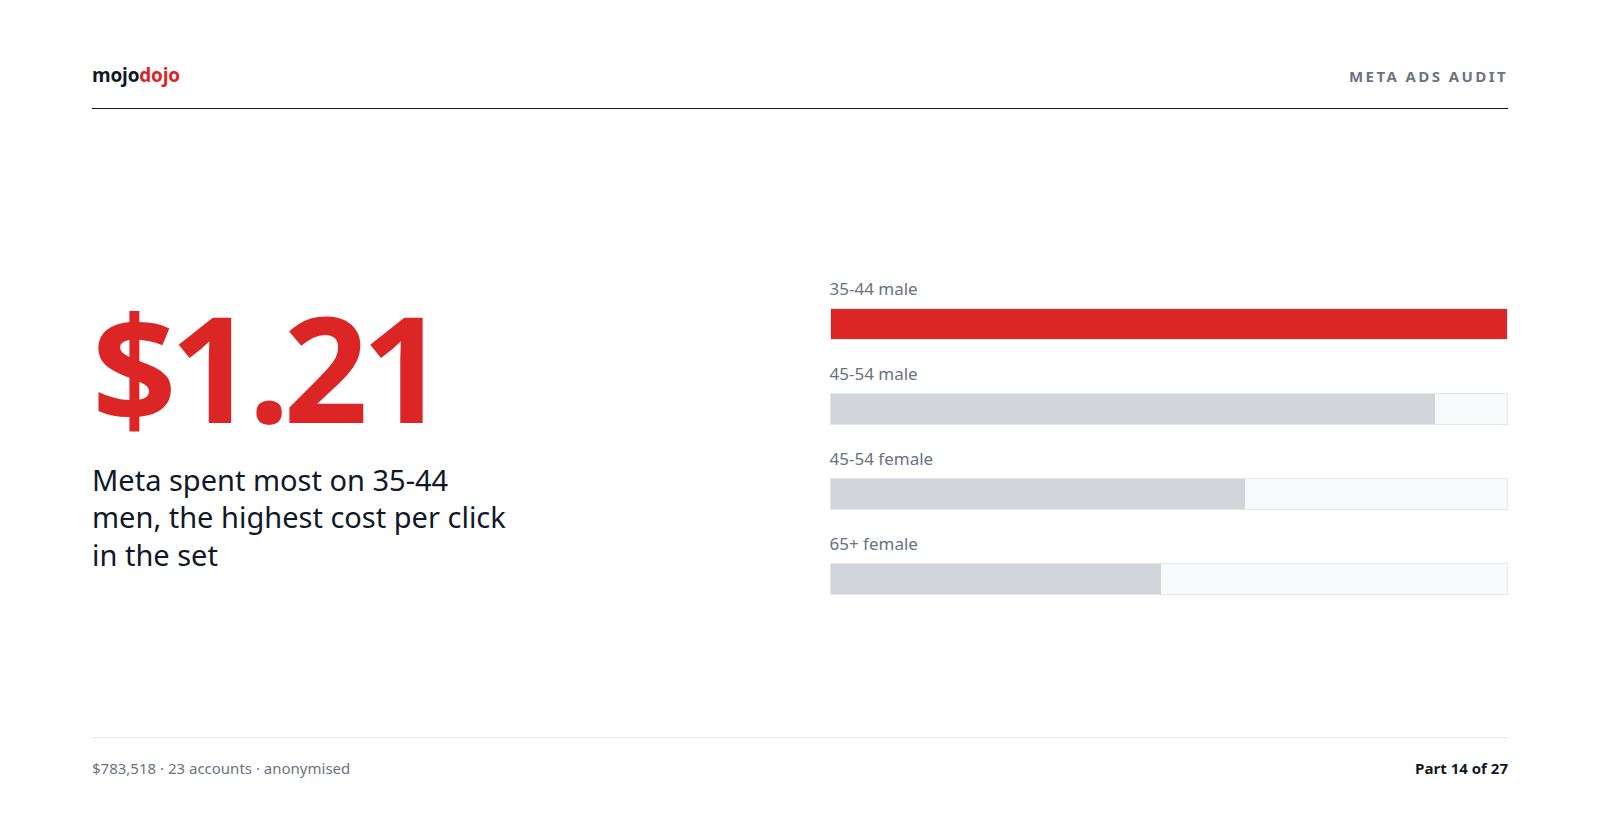
- 15Meta Ads cheap clicks: CPC ranged 2x across age and gender, cost per lead ranged $30 to $44Publishing 6 December
- 16Meta Ads put 94.5% of $783k on phones. Desktop was 1.7% at the highest CPC in the setPublishing 9 December
- 17Meta Ads: 53% of ad sets target a whole country. Only the trades band mostly went localPublishing 12 December
- 18Meta Ads: 58% of ad sets still pick placements by hand. 42% use Advantage+ placementsPublishing 15 December
Structure and money
- 19Meta Ads cost per lead varied 430x between campaigns in the same account, after a volume floorPublishing 18 December
- 20Meta Ads: 216 campaigns chose LINK_CLICKS in 2023 and 2024, after outcome objectives existedPublishing 20 December
- 21Meta Ads: 826 of 1,134 campaigns run lowest cost with no cap. Three use a cost capPublishing 1 January
- 22Meta Ads: the top 10% of ads carry 48% of spend in the median account, 76% in the most concentratedPublishing 5 January
- 23Meta Ads: 1,134 campaigns built since 2013, 67 running. 2026 is already the second-busiest build yearPublishing 8 January
Creative
- 24
- 25Meta Ads frequency: 2.6 median per month, swinging 1.4 to 11.3 inside a single accountPublishing 14 January
Caveated
- 26Meta Ads cost per lead by hour ranged $40 to $101, on the 4.6% of spend the hourly breakdown coversPublishing 17 January
- 27Meta Ads: 39% of paid clicks never fired a landing page view. With a working pixel it was still 35%Publishing 20 January