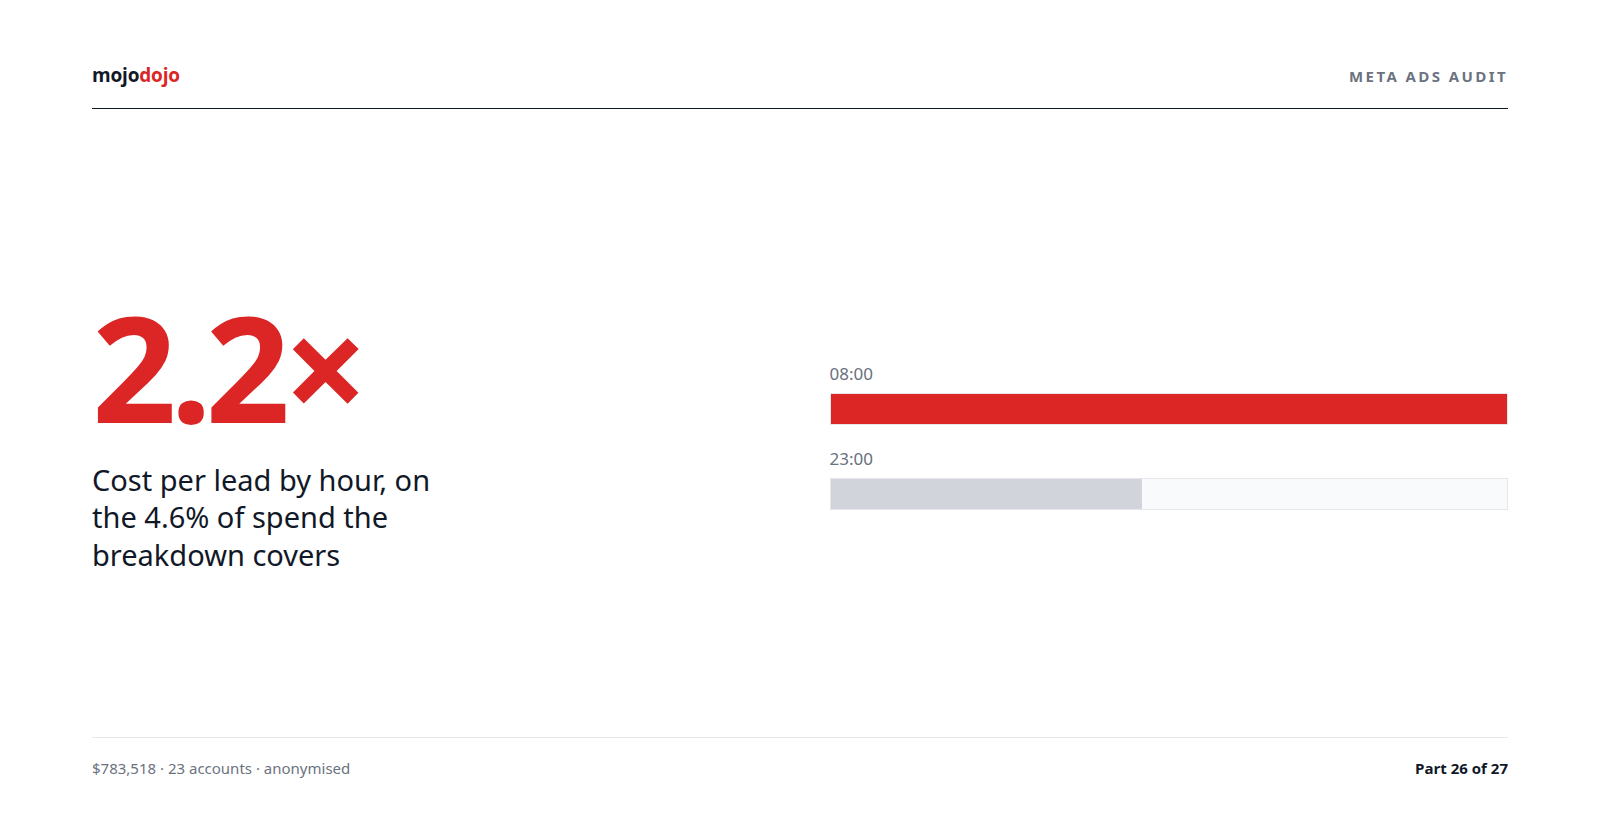


Meta Ads CPM fell 61% from 2023 to 2025 while CTR halved. Cost per click barely moved
Pooled across the AUD accounts in this audit, a thousand Meta impressions cost $21.85 in 2023 and $8.61 in 2025. That is a 61% fall in two years. Over the same two years the click-through rate went from 2.4% to 1.2%. Cost per click, the number most people watch, went from $0.92 to $0.74. Impressions got three fifths cheaper, and the clicks got a fifth cheaper, because most of the discount was spent on impressions nobody clicked.
Two caveats belong in the first paragraph rather than the last. The accounts that make up each year are not the same set: the mix of advertisers changes year to year, and which accounts drive which year is not published in this series. And Meta's monthly insight window reaches back roughly 37 months, so 2023 is a partial year, likely only its final months, while 2026 runs to 9 September. The trend below is real for the pooled money that was spent, and it is not a controlled experiment.
All money is AUD. We pulled monthly account insights for every AUD account, then summed the month rows into calendar years. Every figure in this post is from that one table.
The four years
Year | Spend | Impressions | CPM | CPC | CTR | Landing views ÷ clicks |
|---|---|---|---|---|---|---|
2023 (partial) | $72,732 | 3,328,235 | $21.85 | $0.92 | 2.4% | 30.8% |
2024 | $156,132 | 11,972,595 | $13.04 | $0.86 | 1.5% | 35.3% |
2025 | $312,268 | 36,283,041 | $8.61 | $0.74 | 1.2% | 46.0% |
2026 (to 9 Sep) | $245,897 | 26,071,327 | $9.43 | $0.78 | 1.2% | 51.4% |
Read the CPM column down and it looks like the best news an advertiser could get: each year's thousand impressions cost less than the one before, until a small uptick in 2026. Read the CTR column down and it is the opposite story, told at nearly the same rate. Read the CPC column and almost nothing happened. Those three columns are not three findings. They are one finding, seen from three angles, and the arithmetic that ties them together is the subject of this post.
Here is the same table as year-on-year change.
Period | CPM | CTR | CPC |
|---|---|---|---|
2023 to 2024 | -40.3% | -37.5% | -6.5% |
2024 to 2025 | -34.0% | -20.0% | -14.0% |
2025 to 2026 | +9.5% | 0.0% | +5.4% |
2023 to 2025 | -60.6% | -50.0% | -19.6% |
In both of the big down years, CPM and CTR fell together and CPC moved far less than either. In 2026, CPM ticked up, CTR held, and CPC ticked up by about half the CPM move. Whatever changed about the inventory, it changed the price of an impression and the chance of a click in the same direction at almost the same time.
Why this happens
Cost per click is not an independent metric. It is CPM divided by clicks per thousand impressions, and clicks per thousand is just CTR multiplied by ten. If CPM halves and CTR halves, CPC does not move. The table above is close to exactly that.
Year | CPM | Clicks per 1,000 impressions (CTR x 10) | CPM ÷ clicks per 1,000 | Reported CPC |
|---|---|---|---|---|
2023 | $21.85 | 24 | $0.91 | $0.92 |
2024 | $13.04 | 15 | $0.87 | $0.86 |
2025 | $8.61 | 12 | $0.72 | $0.74 |
2026 | $9.43 | 12 | $0.79 | $0.78 |
The fourth column is computed from the rounded CTR, so it lands within a few cents of the reported CPC in every year. The point is not the cents. It is that CPC is the ratio of the two things that moved, and a ratio of two numbers that both halve is flat. Anyone who watched CPC through 2023 to 2025 saw a metric that barely changed, and would have had no idea that the two metrics underneath it had each moved by half.
What moves CPM and CTR together, in the same direction, at the same time? Inventory. Meta's auction prices an impression by who else wants it, and the supply of impressions grew faster than the demand for them across these years, through Reels, Audience Network, Marketplace and the expansion of automatic placements into all of them. Cheap inventory is cheap because fewer advertisers want it, and fewer advertisers want it because people click it less. Part 9 shows the extreme case in this set: a placement at a $0.32 CPC and a 0.27% CTR, the cheapest and the worst. A pooled account that takes on more of that inventory each year will show exactly this table: falling CPM, falling CTR, stable CPC.
The advertiser mix matters here too, and this is where we have to be careful. The 2023 pool is a fifth the size of the 2025 pool in spend, and it may be dominated by a few accounts with a particular placement profile. Part of the 61% could be composition rather than market. We cannot separate the two from this table, and the series does not publish which accounts are in which year. What we can say is that the pattern, cheaper impressions and rarer clicks in lockstep, held across both down years and reversed in both directions in 2026, which is what you would expect from an inventory effect and not from one account leaving.
What it does to decisions
The first casualty is the CPM benchmark. An advertiser who set a target CPM in 2023 and hit half of it in 2025 did not get twice the value. They got twice the impressions at half the click rate, which is the same number of clicks. Reporting that leads with reach and CPM, as a lot of awareness reporting does, will show a campaign getting dramatically more efficient while the number of people who did anything stayed put.
The second is the CTR benchmark, in the other direction. A 2.4% CTR was the pooled average in 2023. By 2025 it was 1.2%. A creative that held 1.5% across both years would have been above average in 2025 and below it in 2023, having changed nothing. CTR targets carried over from an earlier year, or from an earlier placement mix, will flag good ads as failures.
The third is where the money actually went as the pool grew.
Year | Spend growth on prior year | Impression growth on prior year | Impressions per $100 |
|---|---|---|---|
2023 (partial) | 4,576 | ||
2024 | 2.15x | 3.60x | 7,668 |
2025 | 2.00x | 3.03x | 11,619 |
2026 (to 9 Sep) | 10,603 |
Each time pooled spend roughly doubled, impressions roughly tripled. The incremental dollar bought more impressions than the dollar before it, and those incremental impressions were clicked less. That is what absorbing cheaper inventory looks like from the outside, and it is why a budget increase can show up as a large reach increase and a small click increase in the same month.
The fourth is more hopeful, and it sits in the last column of the first table. The share of clicks that went on to fire a landing page view rose every year, from 30.8% to 51.4%.
Year | CPC | Landing views ÷ clicks | Implied cost per landing page view | Landing page views per 1,000 impressions |
|---|---|---|---|---|
2023 | $0.92 | 30.8% | $2.99 | 7.4 |
2024 | $0.86 | 35.3% | $2.44 | 5.3 |
2025 | $0.74 | 46.0% | $1.61 | 5.5 |
2026 | $0.78 | 51.4% | $1.52 | 6.2 |
Both right-hand columns are arithmetic from the rounded figures in the year table, so treat them as indicative. The implied cost of a click that actually loaded a page fell 46% from 2023 to 2025, more than twice the fall in CPC. There are two ways to read that and we think both are partly true. One is that the clicks which disappeared as CTR halved were disproportionately the ones that never loaded a page, so the surviving clicks are better. The other is that pixel coverage in the pool improved as the mix changed, so more of the landing views were simply being measured. Part 27 separates accounts with a working pixel from those without and finds the gap is real in both. Either way, the right cost metric to have watched across these years was not CPM and not CPC. It was cost per landing page view, and it fell the most.
This is the reason our reporting puts cost per landing page view beside CPC on every campaign row, and puts CPM in a separate reach section where it cannot be mistaken for efficiency. It is the same report we build for Sydney businesses in our Facebook ads management.
Where it varies
This is the one post in the series where the honest answer is that we do not publish the variation. The year table is pooled across all AUD accounts, the accounts in each year are not the same, and giving per-band or per-account CPM by year would let the composition effect masquerade as a market effect. So the variation is stated as a caveat rather than a table: some of what looks like Meta getting cheaper is the pool getting bigger and taking on different placements, and we cannot tell you how much.
What we can say is where the variation would show up if you ran the same table on a single account. The placement breakdown is where CPM and CTR diverge most, and Parts 9 through 12 take each major placement against Feed as the benchmark. An account that added Audience Network, Marketplace or Reels between 2023 and 2025 will show this pattern on its own, because the mix shifted toward inventory that is priced low and clicked rarely. An account that held a fixed placement set will show a much flatter CPM line and a much flatter CTR line, and its CPC will look the same as everyone else's, because CPC is what the auction actually clears at.
What to check in your account
In Ads Manager, set the date range to the maximum, then Breakdown, By time, Month. Add CPM, CTR (link click-through rate) and CPC (cost per link click) as columns and export.
Sum the months into years and compute the year-on-year change for each of the three. If CPM and CTR fell together and CPC held, you have this pattern. If CPC fell as much as CPM did, your CTR held and you got a real discount.
Now Breakdown, By delivery, Placement, for the same range. Sort by CPM ascending. The placements at the top of that sort are the ones that pulled your pooled CPM down. Check their CTR beside it. Part 9 shows what the worst case looks like.
Add Landing page views and compute landing views divided by link clicks per year. If it rose while CTR fell, the clicks you lost were the ones that never arrived, and cost per landing page view is the metric that shows you what happened.
Retire any CPM or CTR benchmark set more than a year ago. Reset it against the current placement mix, or better, against cost per landing page view and cost per result.
If a report leads with reach or CPM as an efficiency measure, move it. Reach and CPM describe what the auction sold you. Cost per landing page view describes what you got.
What you find | What it usually means |
|---|---|
CPM down, CTR down, CPC flat | Placement mix shifted toward cheap inventory |
CPM down, CTR flat, CPC down | A real price fall; check whether it held |
CPM up, CTR up, CPC flat | Mix shifted toward premium placements |
Landing view rate up while CTR down | Lost clicks were mostly non-arrivals |
Impressions tripling on doubled spend | Incremental dollars went to the cheapest placements |
The principle
An impression is not a unit of value. It is a unit of supply, and its price tells you how much of it there is, not how much it is worth. When the supply grows faster than demand, CPM falls and so does the rate at which anyone acts on what they saw, and the two cancel. Cost per click survives that because it is the ratio of the two things that moved. The metric to watch is the one furthest down the chain that you can still measure honestly, and in this set that was the cost of a click that actually loaded a page.