

Meta Ads reports one event under up to nine names. 21 of 23 accounts double-count if you sum the column
In 21 of the 23 Meta Ads accounts we audited, at least one action count appears under two or more differently named action types, over the same lifetime window, to the exact unit. In one manufacturing account a single value appears under nine names. In a consumer goods account, 47% of a naive sum of every action type is a repeat of another row.
We pulled the lifetime actions array for each of the 23 accounts ($783,518 of pooled spend, AUD, Marketing API v23.0, 8 and 9 September 2026) and looked for exact-value collisions: two or more action type keys in the same account carrying an identical count. A value like 274,297 does not appear three times by coincidence. It appears three times because Meta reports the same underlying event under three names.
This is not a configuration mistake anyone made. It is how Meta's reporting is built. The previous post covered one family of composite names. This one covers the whole naming system, and what happens when you add up a column without knowing it.
The 21 accounts
For each account: the number of collision groups (distinct values that appear under more than one name), the largest number of names any single value carries, and the share of a naive all-action-types sum that would be duplicates.
Acct | Band | Collision groups | Max names for one value | Double-count share of naive sum |
|---|---|---|---|---|
A | Consumer goods & food | 16 | 8 | 26% |
F | Manufacturing & equipment | 11 | 8 | 14% |
S | Consumer goods & food | 11 | 8 | 47% |
J | Home improvement & trades | 10 | 6 | 14% |
K | Professional & B2B services | 9 | 7 | 13% |
T | Consumer goods & food | 9 | 8 | 38% |
E | Home improvement & trades | 8 | 4 | 24% |
G | Home improvement & trades | 8 | 6 | 1% |
H | Health & care services | 8 | 8 | 1% |
L | Consumer goods & food | 8 | 6 | 18% |
V | Home improvement & trades | 8 | 4 | 7% |
B | Manufacturing & equipment | 7 | 9 | 9% |
C | Manufacturing & equipment | 6 | 6 | 0% |
M | Home improvement & trades | 6 | 7 | 11% |
N | Professional & B2B services | 6 | 6 | 10% |
Q | Health & care services | 6 | 5 | 0% |
W | Health & care services | 6 | 5 | 1% |
D | Professional & B2B services | 5 | 5 | 18% |
P | Home improvement & trades | 5 | 5 | 1% |
R | Manufacturing & equipment | 5 | 7 | 1% |
U | Health & care services | 3 | 4 | 19% |
The two accounts with no collisions at all, I and O, are both professional services accounts. Everywhere else, the more event types an account records, the more names each one is reported under.
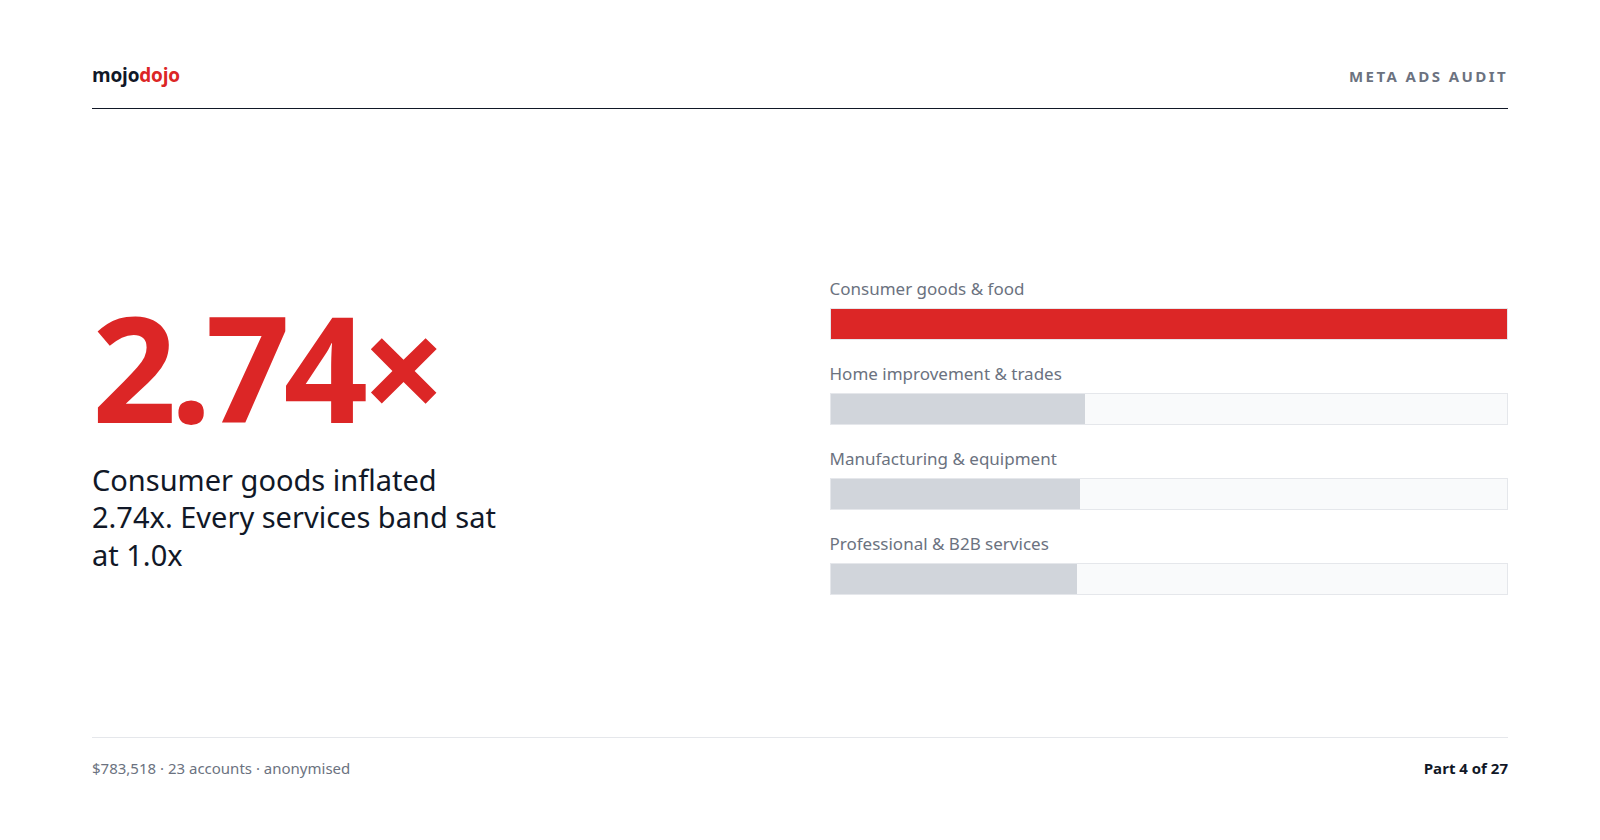
Twelve of the 21 accounts would double-count by 10% or more if summed naively. The three worst (S at 47%, T at 38%, A at 26%) are all consumer goods accounts with a pixel that fires ViewContent on every product page, and ViewContent is the event with the most aliases.
The double-count share is a stress test, not a claim that anyone reports this way on purpose. It answers the question: if a dashboard, a connector or a spreadsheet formula added up every conversion-shaped row Meta returns, how much of the total would be the same event counted again?
The three families that collide
Nearly every collision falls into one of three groups. Here are the largest ones the API returned, by account.
Acct | Value | Names it appears under |
|---|---|---|
A | 274,297 x3 |
|
A | 259,422 x3 |
|
S | 35,435 x4 |
|
T | 1,681 x7 |
|
J | 2,834 x2 |
|
B | 15,774 x2 |
|
H | 254 x5 |
|
M | 6,805 x4 |
|
E | 166 x4 |
|
Landing page views come in a pair: landing_page_view and omni_landing_page_view. The pair appears in J, T, H, V, B, N, D, R and U. Same event, two names, always equal.
Content views are the worst offender. Account A's pixel ViewContent count, 259,422, appears under three names, and a slightly larger roll-up, 274,297, appears under three more. Account T's 1,681 content views appear under seven names. In account S the content view count appears under four names, one of which ends in _add_meta_leads and one of which ends in _add_20_s_calls.
Leads are the family that should worry a lead generation advertiser most, because the aliases have such different names. In account H the value 254 appears under lead, under three offsite_*_add_meta_leads composites, and under one more. Account M's 6,805 leads appear under four names. Account E's 166 under four.
Why this happens: Meta's three naming layers
Meta's action type strings carry a prefix that says where the event was observed, a middle that names the event, and sometimes a suffix that says what else was added. The three layers produce the aliases.
Prefix or pattern | What it means | Example |
|---|---|---|
| Cross-channel roll-up of one standard event across pixel, app, offline and on-Meta sources |
|
| The event happened away from Meta, reported through the pixel or Conversions API |
|
| The event happened on a Meta surface: an instant form, a Messenger thread, a shop |
|
| Newer roll-up names that group the website event with app and on-Meta equivalents |
|
bare name | The legacy standard event name, still returned for compatibility |
|
| A composite: the offsite event plus something else |
|
The omni_ roll-ups are the most defensible: Meta introduced them so an advertiser with a website, an app and an offline feed could see one purchase number. In an account with only a pixel, omni_purchase equals purchase, and both are returned.
The onsite_web_ and onsite_web_app_ names are the confusing ones, because the prefix says onsite and the event is a website pageview. In account A they carry 274,297 against 259,422 for the plain pixel event, so they include something the pixel alone does not. In account T all of them carry 1,681. Whatever the grouping rule is, the practical effect is that a website ViewContent count can come back under up to seven keys.
The _add_* composites are the layer that part 1 was about. offsite_content_view_add_meta_leads is content views plus instant form leads. offsite_content_view_add_20_s_calls is content views plus calls of at least 20 seconds. On a site with no instant forms and no click-to-call, both equal the plain content view count, which is why account S shows the same 35,435 under four keys.
What it does to decisions
Ads Manager itself does not add these up. The Results column reads one action type chosen by the campaign objective, and cost per result divides by that. The problem starts the moment the data leaves Ads Manager.
Where the sum happens | What gets summed | Effect |
|---|---|---|
A connector into a BI tool or a spreadsheet | Every row of the | Inflated total, deflated cost per conversion |
A custom "total conversions" metric | Several action types selected by name | Duplicates wherever two of them are aliases |
A portfolio report across accounts | All conversion-shaped rows per account | Shops inflate most; lead accounts least |
An attribution or MMM feed | Meta conversions as one channel input | Meta over-credited relative to channels that report once |
The first row is the common one. Most third-party connectors pull actions and let the user pick which types to display, and the picker shows the raw action type strings with no indication of which ones are aliases. A person setting up the report for the first time sees view_content, omni_view_content and onsite_web_view_content as three options and has no reason to believe they are one number. The same goes for the lead family, where the names are even less alike. Picking view_content and omni_view_content both, because they sound like different things, doubles content views. Picking lead, onsite_conversion.lead_grouped and offsite_complete_registration_add_meta_leads because they all sound like leads can triple them. Account H's 254 leads become 762 in three columns, and the sum row at the bottom says 1,270 if all five aliases are selected.
The fourth row is the quiet one. Marketing mix models and multi-touch attribution tools take a conversion count per channel as an input. If Meta's input is a summed actions array and Google's is a de-duplicated conversion column, the model credits Meta for events it counted several times over, and every budget reallocation the model recommends inherits the error.
Cost per conversion follows. A total that is 47% repeats means a cost per conversion that is 47% too low, and every optimisation conversation that follows is anchored to it. This is the same shape of error the Google Ads series found in one account counting three conversion actions on one lead, with one difference. In Google Ads the duplication came from people adding tags over the years. In Meta the duplication ships with the API.
Where it varies
The share of a naive sum that is duplicated depends on which event the account records most.
Dominant event in the account | Accounts | Double-count share range | Why |
|---|---|---|---|
Pixel ViewContent (shops) | A, S, T, F | 14% to 47% | ViewContent has up to seven aliases and fires on every page |
Instant form leads | H, Q, W, B, C, P, G | 0% to 9% | The lead aliases collide, but leads are a small share of all actions |
Landing page views and engagement | D, U, L, E | 18% to 24% | Landing page views pair with |
Messaging | K, V | 7% to 13% | Messaging events share values across first reply, connection and conversation started |
Two things to note on the floor. The nine-name value in account B is smaller than the two groups the API listed for it (15,774 and 123), and small values collide by coincidence more easily than large ones. So the headline "nine names" is real in the data, but the safer statement is that values in the thousands appear under three to seven names in every shop in the set. Account U has only three collision groups, and one of them is a value of 3, which could be coincidence.
Account W has an interesting one: onsite_conversion.messaging_block and onsite_conversion.messaging_conversation_started_7d both carry 136. Those are not aliases of each other. They are two different things that happen to have the same count, or something worth looking at, and part 6 looks at it.
What to check in your account
Pull the
actionsarray for your account over a wide date range through the Marketing API, or export All columns from Ads Manager with every conversion column visible.Sort the action types by value. Any two adjacent rows with an identical count are candidates. Any group of three or more with an identical count in the thousands is a certain alias.
For each group, pick one canonical name. For website purchases use
purchaseoromni_purchase, not both. For leads useleadfor pixel leads andonsite_conversion.lead_groupedfor instant forms, and never add either to an_add_meta_leadscomposite.Open whatever tool reports Meta conversions outside Ads Manager. List the action types it maps to "conversions". Remove every alias of a name already on the list.
Recompute cost per conversion for the last twelve months against the de-duplicated list, before comparing this month to last.
Write the canonical list down where the next person will find it.
That last step is the one that lasts. In our Facebook Ads management work we keep a per-account map of exactly one action type per business outcome, and every report reads from the map, not from the array.
The principle
A count that arrives under several names is still one count. Meta's naming system is descriptive and internally consistent, but it was designed so that every reporting surface could find the event it wanted under a name it recognised, not so that all of the names could be added together. The moment data leaves the interface that knows this, the aliases become rows, and rows get summed. Decide the one name you trust for each outcome, and let everything else be a cross-check.