

Meta Ads frequency: 2.6 median per month, swinging 1.4 to 11.3 inside a single account
Ads Manager has a Frequency column. Set the date range to the account's whole history and it gives you a single number: impressions divided by the people reached. For the 16 accounts in this audit with enough reach to measure it, that lifetime number ran from 2.1 to 8.2. We do not think anyone should act on it.
We pulled reach and impressions month by month for every account from the Meta Marketing API, kept only the months in which at least 5,000 people were reached, and worked out frequency for each of those months. The median monthly frequency across the 16 accounts is 2.6. Behind that median, one manufacturing account (account C) ran at 1.4 in its lightest month and 11.3 in its heaviest. Its lifetime frequency is 7.4, which describes neither.
That is the finding. Frequency is a range, not a number, and the version Meta shows by default is the least useful one. All money in this series is pooled AUD across 23 accounts ($783,518 lifetime). This post is about rates, so the spend does not appear again.
Sixteen accounts, three ways of reading the same impressions
The table below is the whole pack for this post. Months is the count of months that cleared the 5,000-reach floor. Lifetime frequency is what the API returns when you ask for the full history in one row. The monthly columns come from the same impressions, cut month by month.
Acct | Band | Months | Lifetime frequency | Median monthly | Min month | Max month | Peak month |
|---|---|---|---|---|---|---|---|
C | Manufacturing & equipment | 23 | 7.4 | 2.2 | 1.4 | 11.3 | 2025-11 |
A | Consumer goods & food | 38 | 7.6 | 3.5 | 1.8 | 8.4 | 2026-02 |
S | Consumer goods & food | 24 | 6.4 | 3.8 | 1.5 | 8.3 | 2024-04 |
M | Home improvement & trades | 38 | 5.8 | 3.4 | 2.0 | 4.8 | 2025-08 |
V | Home improvement & trades | 8 | 7.0 | 3.5 | 1.4 | 4.7 | 2025-12 |
G | Home improvement & trades | 38 | 8.2 | 3.0 | 1.9 | 4.3 | 2024-01 |
W | Health & care services | 16 | 5.2 | 2.9 | 1.8 | 3.9 | 2026-07 |
F | Manufacturing & equipment | 26 | 3.5 | 2.3 | 1.6 | 3.5 | 2024-10 |
H | Health & care services | 16 | 2.1 | 1.7 | 1.2 | 3.5 | 2026-05 |
J | Home improvement & trades | 12 | 4.2 | 2.7 | 1.9 | 3.5 | 2026-08 |
D | Professional & B2B services | 7 | 3.7 | 2.7 | 1.8 | 3.2 | 2025-12 |
L | Consumer goods & food | 8 | 3.4 | 2.4 | 2.0 | 3.1 | 2025-07 |
N | Professional & B2B services | 16 | 6.4 | 2.6 | 1.7 | 3.1 | 2026-01 |
Q | Health & care services | 18 | 4.0 | 2.0 | 1.1 | 3.1 | 2026-04 |
P | Home improvement & trades | 18 | 4.2 | 2.5 | 1.2 | 2.9 | 2025-09 |
T | Consumer goods & food | 10 | 3.4 | 1.8 | 1.6 | 2.5 | 2024-05 |
Three things to read off it.
First, the lifetime column overstates every account's monthly reality. Not one of the 16 has a lifetime figure below its median month. Account G reports 8.2 lifetime and a median month of 3.0. Account N reports 6.4 and 2.6. Account C, 7.4 and 2.2. Even account V, with only eight qualifying months, shows 7.0 lifetime against 3.5 in a typical month.
Second, the monthly medians cluster. Thirteen of the 16 sit between 2.0 and 3.5. Account S is the highest at 3.8, account H the lowest at 1.7. That cluster, and the 2.6 in the middle of it, is the honest answer to "what frequency do these accounts run at".
Third, the min and max columns are where the story is. Account C ranges from 1.4 to 11.3. Account A from 1.8 to 8.4. Account S from 1.5 to 8.3. Then there is a group that barely moves: account T never left 1.6 to 2.5 in ten months, account L stayed between 2.0 and 3.1, account D between 1.8 and 3.2.
Seven accounts (B, E, I, K, O, R, U) had no month that cleared the 5,000-reach floor, so they are not in the table.
Why the lifetime number is meaningless
Meta defines frequency as impressions divided by reach, and reach as the number of unique accounts that saw an ad at least once in the date range you asked for. The word doing the work is "unique". Reach is de-duplicated over whatever range you request. Someone who saw account G's ads in January 2024 and again in August 2026 is one person in a lifetime reach figure, and every impression they were served in between goes into the numerator.
So a lifetime frequency does not measure pressure. It measures duration. The longer an account has run, the more often the same people have been re-reached across separate campaigns, and the higher the ratio climbs, without any single person having seen the ads more often in any given week or month. Accounts A, M and G have 38 qualifying months each and lifetime figures of 7.6, 5.8 and 8.2. Account H has 16 months and a lifetime figure of 2.1.
The API makes the point itself. Meta documents reach as non-additive across time ranges: you cannot sum twelve monthly reach figures into a yearly one, because the same people appear in several months. The insights edge with time_increment=monthly returns a fresh de-duplicated reach for every month, and a fresh frequency with it. Run the same query with date_preset=maximum and you get one row in which reach has been de-duplicated across the entire history. Both are correct. Only one says anything about how hard the audience is being worked.
Acct | Lifetime frequency | Median monthly | Lifetime as a multiple of the median month |
|---|---|---|---|
C | 7.4 | 2.2 | 3.4x |
G | 8.2 | 3.0 | 2.7x |
N | 6.4 | 2.6 | 2.5x |
A | 7.6 | 3.5 | 2.2x |
V | 7.0 | 3.5 | 2.0x |
Q | 4.0 | 2.0 | 2.0x |
L | 3.4 | 2.4 | 1.4x |
D | 3.7 | 2.7 | 1.4x |
H | 2.1 | 1.7 | 1.2x |
Worked from the two columns above, the lifetime figure sits anywhere from 1.2x to 3.4x the median month depending on how long the account has run and how much of its audience overlaps from campaign to campaign. The interface does not say which multiple applies to the account in front of you.
What a single average hides
There is a second problem, and it applies to the monthly figure too. Frequency is a mean. The API returns impressions, reach and their ratio. It does not return a distribution of how many times each person was reached. A monthly frequency of 2.6 can be everyone seeing the ad two or three times, or most people seeing it once and a small group seeing it fifteen times.
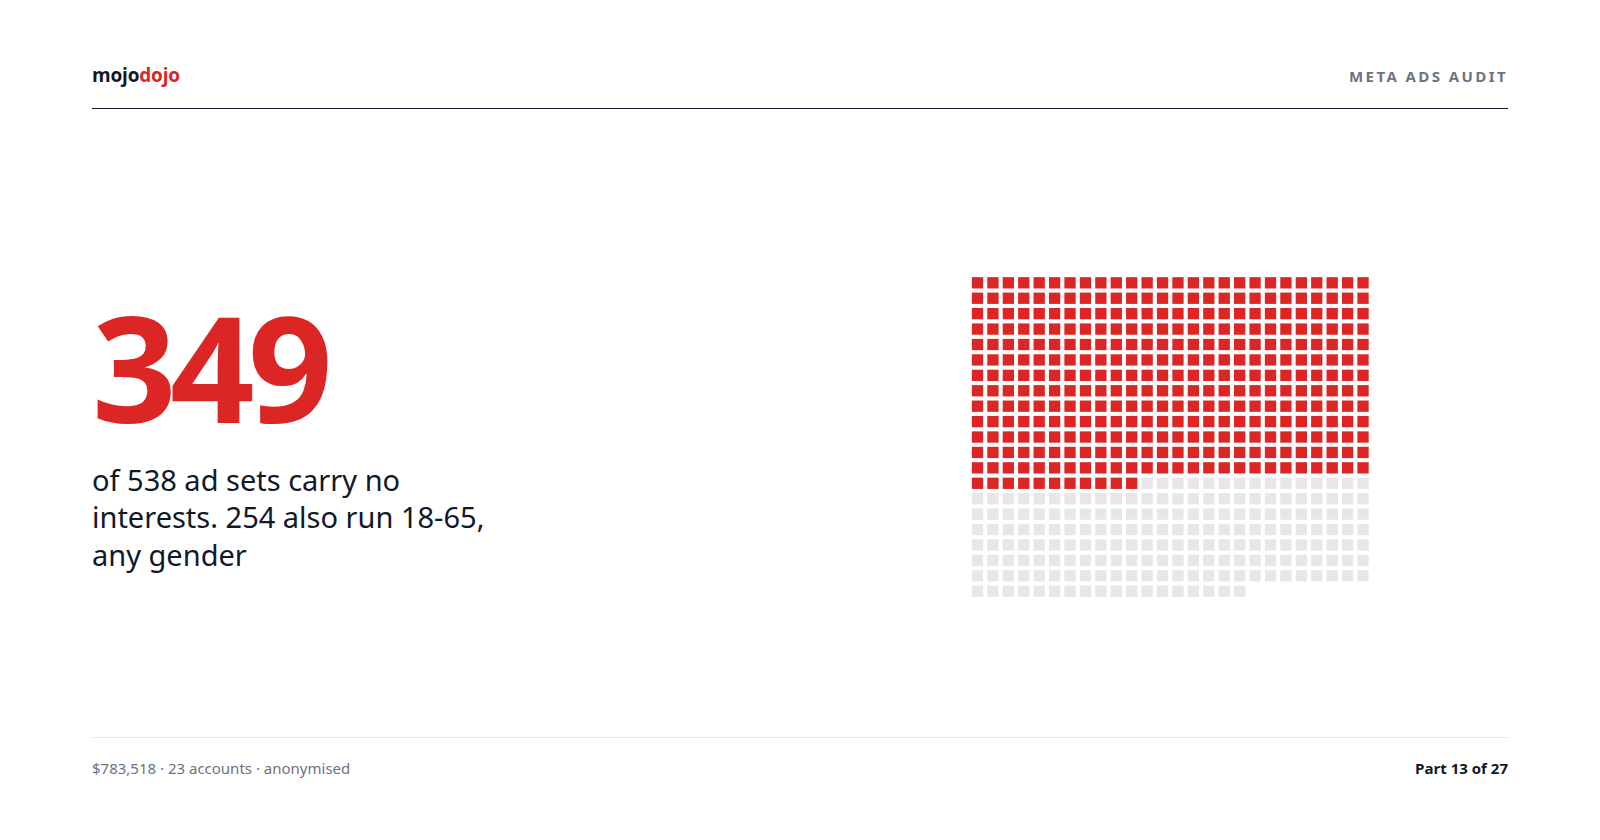
On a broad audience the second pattern is the likelier one. Post 13 found 254 ad sets running 18-65, any gender, no interests. The delivery system's job on an audience that size is to find the people who respond and keep showing them the ad. Reach grows slowly, impressions concentrate, and the mean stays flat while the people carrying the campaign see the ad far more often than it suggests.
That is why the max-month column matters more than the median. Account C's 11.3 in November 2025 is a mean across everyone reached that month. Whatever was happening to the heaviest-served slice of that audience was worse than 11.3.
What it does to decisions
Frequency is used in two decisions: when to change creative, and whether an audience is exhausted. Both go wrong if the number underneath is the wrong one.
Judged on the lifetime column, eight of the 16 accounts have a figure above 5, which most rules of thumb would call saturated. Judged on the monthly median, none of them does, and only three accounts (C, A and S) have ever had a month above 5. The lifetime view says "refresh everything". The monthly view says "refresh in the specific months that spiked, in the three accounts that spiked". Those are different amounts of work and different amounts of creative budget.
The other direction is worse. A team that has learned to ignore the lifetime figure will look at the median instead and see 2.6, a comfortable number. The peak month is invisible unless somebody breaks the report down by month and sorts it. Account C's 11.3 does not appear in any default Ads Manager view.
The connection to post 22 is direct. The top 10% of ads carried 48% of spend in the median account and 76% in the most concentrated one. When one ad carries most of the budget and the audience is fixed, frequency on that ad rises faster than the account average shows. It is one of the first things our Melbourne Facebook advertising team looks at, and it is never the number on the overview screen.
Peak year | Accounts | Count |
|---|---|---|
2024 | G (Jan), S (Apr), T (May), F (Oct) | 4 |
2025 | L (Jul), M (Aug), P (Sep), C (Nov), V (Dec), D (Dec) | 6 |
2026 | N (Jan), A (Feb), Q (Apr), H (May), W (Jul), J (Aug) | 6 |
Six of the 16 accounts hit their peak month in 2026, six in 2025 and four in 2024. The spikes are not an artefact of early campaigns since tidied up. They are happening now.
Where it varies
Band | Accounts in the table | Monthly medians | Highest single month |
|---|---|---|---|
Home improvement & trades | 5 (M, V, G, J, P) | 2.5 to 3.5 | 4.8 (M) |
Consumer goods & food | 4 (A, S, L, T) | 1.8 to 3.8 | 8.4 (A) |
Manufacturing & equipment | 2 (C, F) | 2.2 to 2.3 | 11.3 (C) |
Health & care services | 3 (W, H, Q) | 1.7 to 2.9 | 3.9 (W) |
Professional & B2B services | 2 (D, N) | 2.6 to 2.7 | 3.2 (D) |
Home improvement is the tightest band: five accounts with medians from 2.5 to 3.5 and no month above 4.8. Consumer goods is the widest: medians from 1.8 (account T) to 3.8 (account S), and two of the three accounts that ever cleared 8 in a month. Manufacturing is two accounts at 2.2 and 2.3, and one of them, account C, produced the highest single month in the set. Health and professional services sit low, 1.7 to 2.9, and never peaked above 3.9.
Two floor notes. Accounts D, V and L rest on seven or eight qualifying months, and account T on ten, so their ranges describe a short period and should not be read as a stable pattern. And the band figures are per-account medians grouped by band, not a pooled band frequency; with two or three accounts per band, one account moves the range.
What to check in your account
In Ads Manager, add the Frequency column (Columns, Performance) and set the date range to the last 30 days, not Lifetime. Write the number down.
Now set the date range to Lifetime and write that down too. The gap between the two is the multiple this post describes. If it is above 2x, the lifetime figure has been quietly overstating saturation in every report it has appeared in.
Use Breakdown, By time, Month, and export. Sort by frequency. The highest month is the one to compare against the creative changelog: what was running, on what audience, and had the ad set been narrowed.
Ignore any month with fewer than 5,000 people reached. Below that, the ratio is noise.
In the API, request
impressions,reach,frequencywithtime_increment=monthlyanddate_preset=maximum, and apply the same floor.For any ad set carrying most of the budget, repeat step 1 at ad level. The account average will not show you the ad that has been seen ten times by everyone in a small audience.
If a peak month coincides with an ad set whose audience is small relative to its monthly reach, the lever is audience size or creative rotation, not the Frequency cap setting, which is only available on awareness-optimised ad sets.
The principle
Any ratio with "unique" in its denominator is only meaningful over the period the de-duplication was done on. Stretch the period and the denominator stops growing while the numerator keeps counting, and the ratio measures how long you have been advertising rather than how hard anyone has been hit. Pick the period that matches the decision (a month for creative rotation), apply a reach floor, and read the range rather than the average. The average is the number that never looks alarming and never tells you which month went wrong.